
ASGairport
NewAirline-grade network planning, for airports: from demand forecast to profitability forecast.
How do you build the business case for a new route before you pitch it to an airline?
ASGairport builds the business case for a new route, from demand forecast to profitability, using actual O&D data, stimulation from real route launches and QSI-based market share across every option.
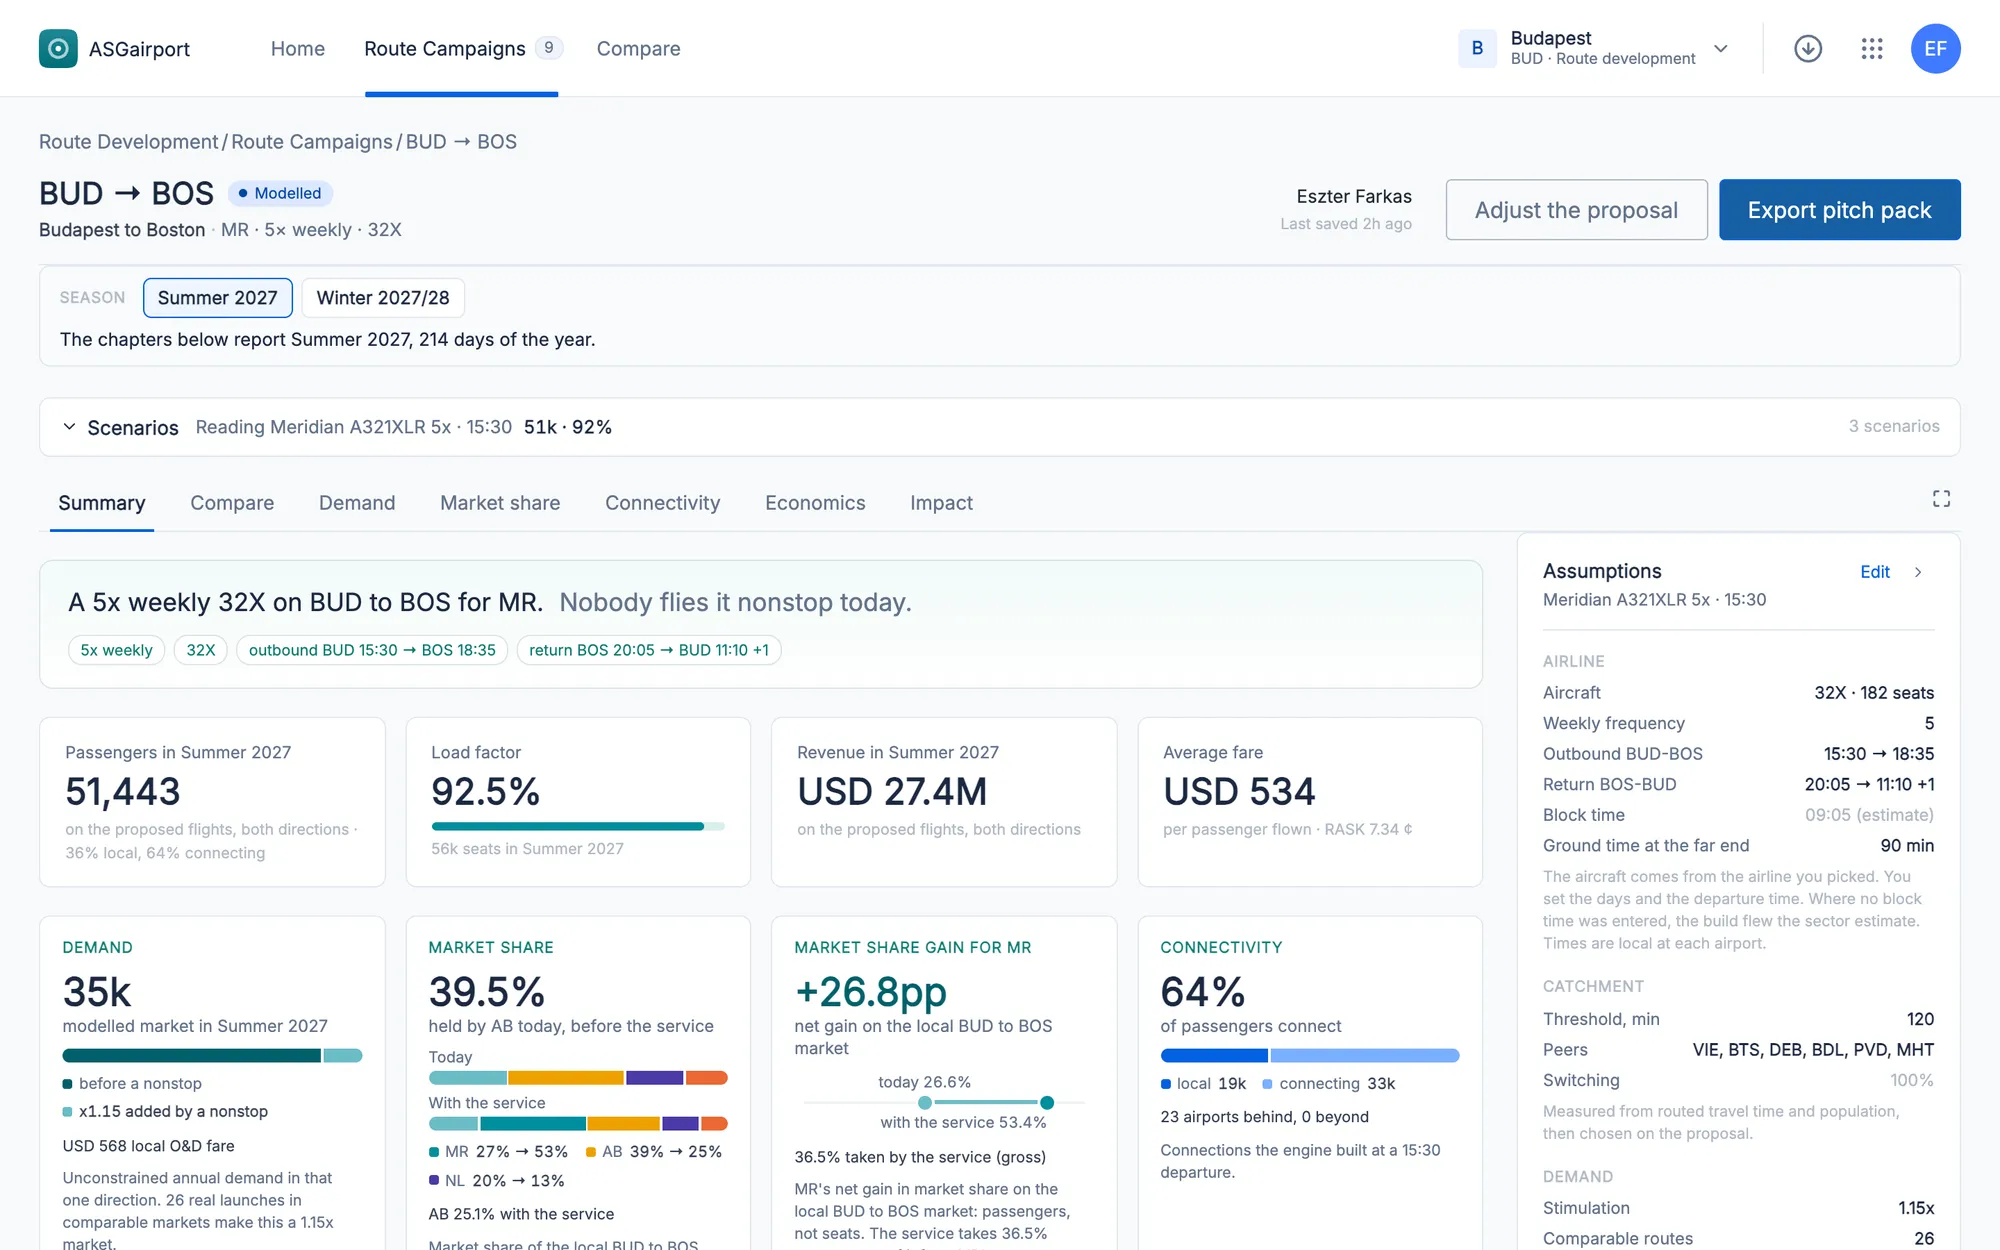
Screenshot from the application. Figures are modeled and illustrative.
What ASGairport is used for
01Airline targeting
ASGairport finds the airlines closest to flying your route, ranked from facts such as where they are based, how far they fly and which aircraft they operate. You start with a shortlist an airline planner will recognize.
02Catchment and leakage
ASGairport maps who lives within reach of both ends of the route, using a 1 km population grid and real drive times. See how many passengers could move from neighboring airports to yours.
03Demand stimulation
New routes create new travelers. ASGairport sizes that new demand from what real launches delivered, and lists every route behind the number so you can talk the forecast through route by route.
04Schedule and connectivity
Set the departure, block and ground times and see how your flight lines up with the flights feeding it and the ones it connects onward. One slider finds the schedule with the most connections.
Designed by airline people for airports, ASGairport focuses on what matters most:
Efficiency
Start fast or go deep. A Quick Campaign gives a first view of a route's potential in moments; a Full Campaign lets you adjust every parameter one by one.
Reliability
Forecasts are grounded in evidence, drawn from 100,000+ real route launches and capacity additions since 2014.
Speed
Challenged on a number? Change it in the room: move the fare, cost and fuel sliders and watch profit respond as you go.
Flexibility
Test them all. One click adds every frequency from once to seven times a week, mixing aircraft, days and departure times.
From demand forecast to profitability
- 01Demand forecast
Actual O&D data
Forecast the market size using leakage and recapture and stimulation from real route launches
- 02Market share
QSI across every option
Determine market share by leveraging consumer behavior and the quality of the schedule offered
- 03Load factor
Spill and recapture
Calculate your load factor based on market capacity, and test different frequency scenarios
- 04Revenue
Weighted O&D flows on board
Understand who is on board and whether the flight is serving its strategic purpose
- 05Profitability
Reportable
Full P&L-level results, not just load factor and revenue
User interface
- Quick and Full Campaigns
- Dynamic connectivity map
- Excel download of any table
- ASGchat, your AI partner
Support
Online support is available via an AI chat bot as well as through more traditional online help files.


